Genetics and evolution account for roughly 20% of USABO Open Exam content, and unlike pure recall topics, they reward a skill you can drill: solving problems under time pressure. Hardy-Weinberg allele frequencies, pedigree inheritance, dihybrid ratios, and chi-square tests are the recurring engines behind olympiad-style genetics questions. This playbook breaks down how to attack each, so a fifth of the paper becomes your strongest section rather than your slowest. Confirm current content weights and format on the USABO overview and cee.org.
Why genetics is different from the rest of the syllabus
Most of the USABO syllabus — anatomy, cell biology, plant systems, ecology — rewards breadth of knowledge. Genetics and evolution are different: they hand you a scenario and ask you to compute or deduce. That is good news, because calculation is learnable in a way that memorising every hormone is not. A student who has drilled twenty Hardy-Weinberg problems will solve the twenty-first almost automatically, freeing scarce exam minutes for the recall-heavy questions elsewhere. With 50 questions in 50 minutes and no penalty for wrong answers, speed and accuracy in this section pay off twice: you bank the marks and you buy time.
| Question engine | What it tests | The tool you reach for |
|---|---|---|
| Hardy-Weinberg | Allele & genotype frequencies in a population | p + q = 1 and p² + 2pq + q² = 1 |
| Pedigree analysis | Mode of inheritance from a family tree | Rule-out logic (dominant/recessive, autosomal/X-linked) |
| Monohybrid / dihybrid crosses | Offspring ratios from known genotypes | Punnett square or the multiplication rule |
| Chi-square (χ²) | Whether observed data fit an expected ratio | χ² = Σ(O−E)²/E, then compare to critical value |
| Linkage & recombination | Gene distance from recombinant frequency | Map distance (cM) = % recombinants |
Hardy-Weinberg: the highest-yield formula to automate
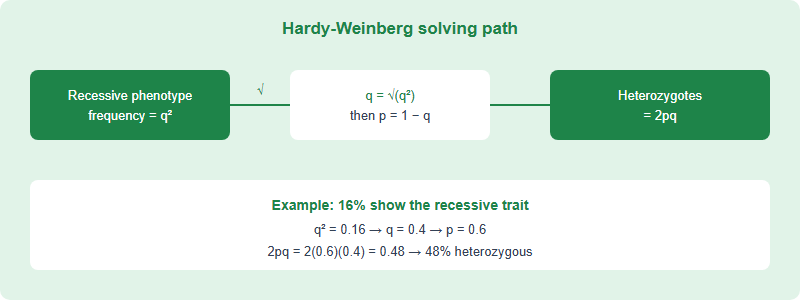
Hardy-Weinberg is the classic population-genetics engine and appears in many forms. The setup is always two equations: allele frequencies p + q = 1, and genotype frequencies p² + 2pq + q² = 1, where p² is homozygous dominant, 2pq heterozygous, and q² homozygous recessive. The trick that unlocks most questions: you are usually given the frequency of the recessive phenotype, which equals q². Take the square root to get q, subtract from 1 to get p, then compute anything else.
Worked logic: if 16% of a population shows a recessive trait, then q² = 0.16, so q = 0.4 and p = 0.6. Heterozygotes are 2pq = 2(0.6)(0.4) = 0.48, or 48% of the population. That single chain answers a whole family of questions. Drill it until the square-root step is reflex. Watch for the assumptions the model requires — no selection, no mutation, no migration, random mating, large population — because exam questions love to ask which assumption is violated.
Pedigrees: solve by ruling out, not guessing
Pedigree questions give you a family tree and ask for the mode of inheritance. The reliable method is elimination, in order:
- Dominant or recessive? If two affected parents have an unaffected child, the trait is dominant. If two unaffected parents have an affected child, it is recessive (the parents are carriers).
- Autosomal or X-linked? For a recessive trait, look at affected females: an affected daughter of an unaffected father argues against X-linked recessive (her father would have to be affected). X-linked recessive traits appear far more often in males.
- Check for a “must-be-carrier” contradiction. Once you hypothesise a mode, assign genotypes and see whether any individual is forced into an impossible one. A contradiction rules the hypothesis out.
Practise stating the elimination out loud: “unaffected parents, affected child, so recessive; affected daughter with unaffected father, so not X-linked; therefore autosomal recessive.” That verbal chain is faster and less error-prone than staring at the tree hoping the answer appears.
Chi-square: the test students fear and shouldn’t
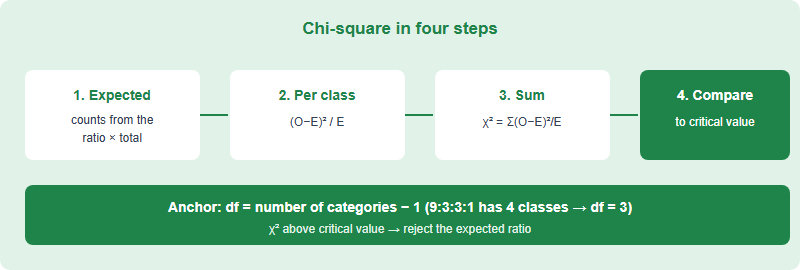
Chi-square (χ²) checks whether observed offspring numbers fit an expected ratio — for example, does a dihybrid cross really give 9:3:3:1? The formula is χ² = Σ(O−E)²/E, summed across categories. Steps: compute expected counts from the ratio and total sample size; find (O−E)²/E for each category; sum them; then compare the total to a critical value at the appropriate degrees of freedom (categories minus one). If χ² exceeds the critical value, you reject the hypothesis that the data fit the expected ratio.
The single most common error is computing degrees of freedom wrong, so anchor it: df = number of categories − 1. For a 9:3:3:1 cross with four phenotype classes, df = 3. The second most common error is forgetting to use expected counts, not expected proportions, in the denominator. Drill three or four of these end-to-end and the fear evaporates — it is arithmetic with a lookup at the end.
Crosses and linkage: the multiplication rule saves time
For multi-gene crosses, a full 16-box Punnett square is slow. Faster: treat each gene independently and multiply probabilities. To find the chance of an offspring being homozygous recessive at two independently assorting genes, multiply the probability at each gene (for a heterozygote cross, 1/4 × 1/4 = 1/16). This “multiplication rule” scales to three or four genes where a Punnett square becomes unmanageable. For linked genes, recombination frequency estimates map distance in centimorgans (map distance ≈ % recombinant offspring), and a recombination frequency approaching 50% signals genes that assort independently. Keep the tools separate in your head: independent assortment → multiply; linkage → recombinant frequency.
How to drill this section in one week
Pull genetics questions from the USABO past-paper pack and group them by engine rather than by year. Do five Hardy-Weinberg problems back-to-back until the method is automatic, then five pedigrees, then chi-square, and so on. Grouping by type builds pattern recognition much faster than mixed practice at this stage. Once each engine is reliable, switch to mixed timed sets to rebuild exam realism. Students on the China-region pathway often find this is the fastest single section to improve, precisely because it is skill, not encyclopaedic recall. Confirm the current syllabus emphasis on cee.org, as content details can shift between seasons.
Frequently asked questions
How much of USABO is genetics and evolution?
Roughly 20% of Open Exam content per the published weights, though exact emphasis can vary by season — confirm on cee.org.
Do I need to memorise the chi-square critical values?
Focus on the method and degrees of freedom. Whether a table is provided depends on the exam; confirm current conditions on cee.org.
What is the fastest genetics topic to improve?
Hardy-Weinberg. It is one formula chain that, once automated, answers a whole family of population-genetics questions.
Punnett square or multiplication rule?
Use a Punnett square for one or two genes, and the multiplication rule for multi-gene crosses where a square becomes too large.
This is an independent guide operated by Hanlin Education for China-based international-school students. It is NOT affiliated with, endorsed by, or sponsored by the Center for Excellence in Education (CEE). Competition rules, content weights and formats can change between seasons — confirm current details on cee.org. Any error will be corrected within 7 working days of notification.