Most USABO candidates can recite the definitions of Km and Vmax. Far fewer can look at two hyperbolic curves or a small data table and say in under thirty seconds what changed. The item usually is not asking for a formal derivation. It is asking whether you can tell the difference between “the enzyme is working less efficiently” and “the enzyme has effectively lost active sites,” and whether you can connect that difference to substrate affinity. This article sets out a short, repeatable routine for reading inhibition data on the USABO and on the British Biology Olympiad, both of which reward quantitative enzyme kinetics that sits above the standard AP, A-Level and IB Biology treatment.
First, name the quantities precisely
Four terms run through almost every inhibition item, and mixing them up is where most candidates lose marks. Understanding the underlying assumptions of the Michaelis-Menten model is critical before interpreting any graph.
- Initial velocity (v0): the rate measured at the very start of the reaction, before substrate is significantly consumed or product accumulates. Kinetic parameters are defined on v0, not on average rate over a long incubation. If the graph shows product concentration over time, it is likely a progress curve, not a kinetic parameter plot.
- Substrate concentration ([S]): usually plotted on the x-axis. Units are molar (mM is common in textbook figures).
- Vmax: the plateau the rate approaches as [S] increases without bound, assuming the simple Michaelis-Menten model. It represents the maximum catalytic capacity of the enzyme when all active sites are saturated. It is a theoretical asymptote; you never literally measure it, you infer it from the shape of the curve.
- Km: the [S] at which v0 equals half of Vmax. It is an inverse proxy for apparent substrate affinity under the stated conditions. A low Km indicates high affinity; a high Km indicates low affinity.
Two conventions are worth holding in mind. First, all of these are apparent values when an inhibitor is present; the item may deliberately write Kmapp or Vmaxapp. Second, the model assumes no cooperativity (Hill coefficient = 1) and no allosteric regulation unless specified. If the curve is sigmoidal rather than hyperbolic, the classical Km/Vmax analysis does not apply directly.
Rate vs. equilibrium: check which question you have been asked
A large fraction of missed enzyme items comes from answering the wrong question. USABO figures often mix two families of tasks. If the horizontal axis is time and the vertical axis is product concentration, and the item asks about final concentrations or direction of net flux, you are likely in equilibrium territory: the enzyme affects how quickly equilibrium is reached, not where it sits. If the horizontal axis is [S] and the vertical axis is v0, you are in kinetics territory, and the relevant tools are the ones below. Our earlier walk-through of this distinction is at USABO Enzyme Experiments: Distinguish a Rate Change From an Equilibrium Change; use it if you frequently find that the arithmetic is fine but the answer is wrong.
How each inhibitor class shifts apparent Km and Vmax
The three classical classes are defined by where the inhibitor binds and therefore by how the apparent parameters move. Memorizing the mechanism helps predict the graph shape.
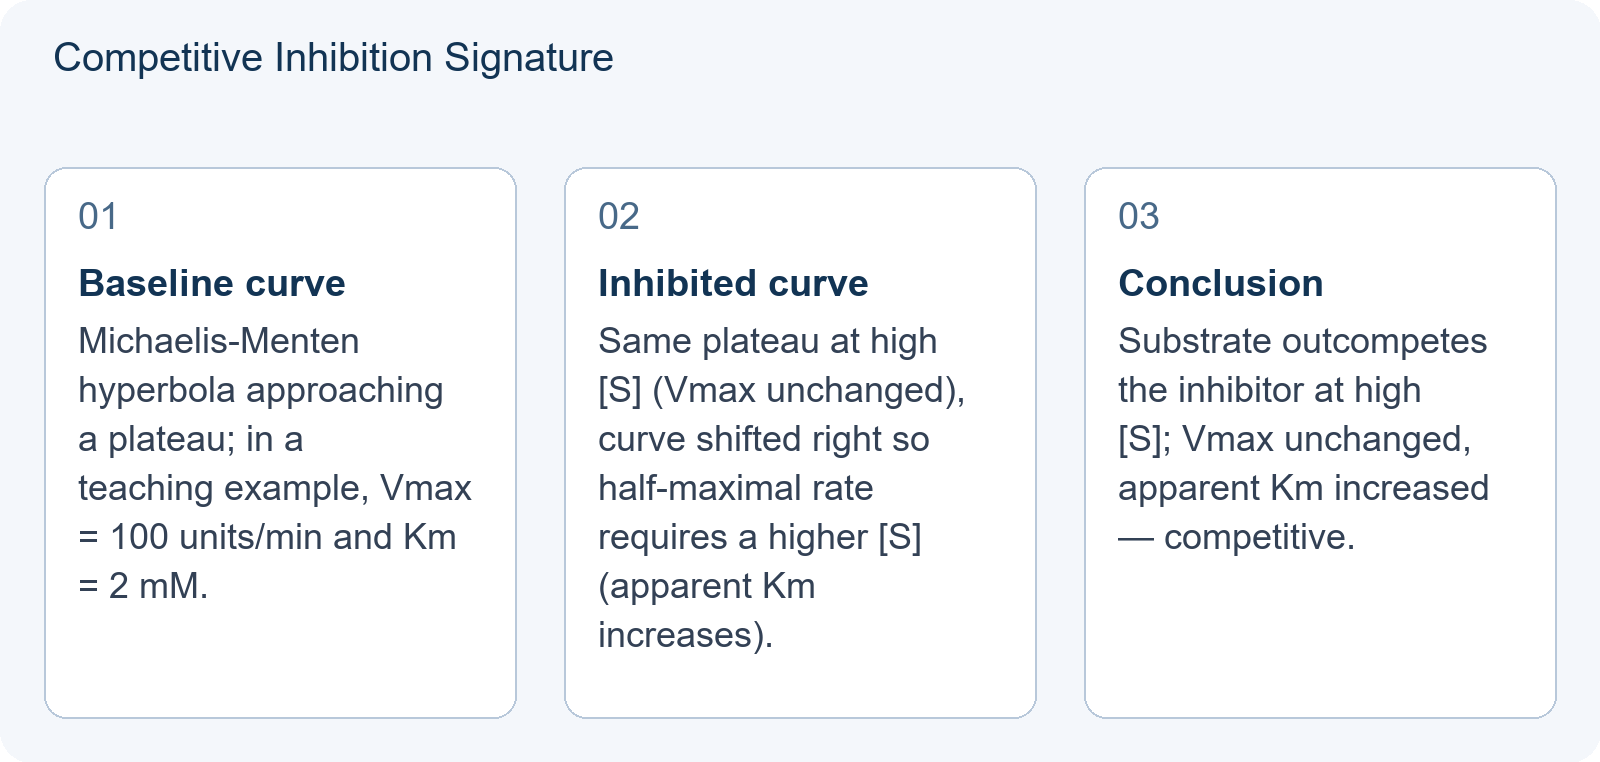
- Competitive inhibition. The inhibitor binds the free enzyme at the active site and is displaced by substrate at high [S]. The active sites still exist and can still turn over, so Vmax is unchanged; but you need more substrate to reach half-saturation, so apparent Km rises. On a Lineweaver-Burk plot, the lines intersect at the y-axis.
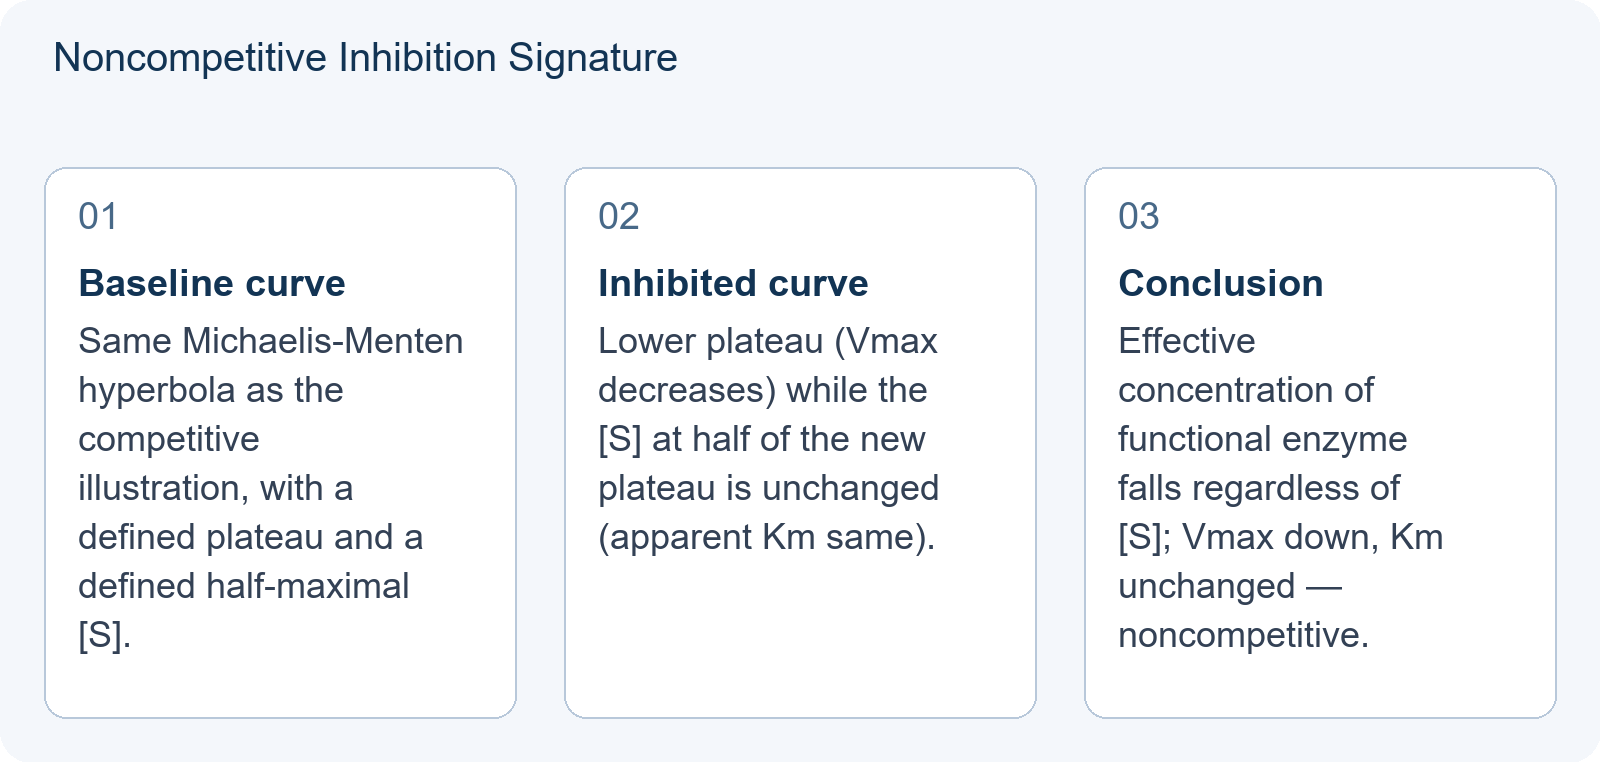
- Noncompetitive inhibition (pure form). The inhibitor binds a site distinct from the active site with the same affinity for free enzyme and for enzyme-substrate complex. It reduces the effective concentration of functional enzyme regardless of [S], so Vmax falls; the affinity of the remaining productive enzyme for substrate is unchanged, so apparent Km is unchanged. On a Lineweaver-Burk plot, the lines intersect at the x-axis.
- Uncompetitive inhibition. The inhibitor binds only the enzyme-substrate complex. Removing ES complexes from the productive pool pulls the binding equilibrium toward more ES formation, so apparent Km decreases and, because some ternary complexes never turn over, Vmax also falls. Both parameters move in the same direction. On a Lineweaver-Burk plot, the lines are parallel.
Many modern biochemistry texts also describe a mixed class in which the inhibitor binds free enzyme and ES complex with different affinities; in that case Vmax decreases and apparent Km can rise or fall. USABO items usually stick to the three classical classes, but if a table shows Vmax down and Km mildly up, check whether the shift is large enough to be meaningful before labeling it mixed.
A labelled teaching illustration: reading a small table
The numbers below are a teaching illustration, constructed by us to be internally consistent with the Michaelis-Menten model. They are not drawn from a USABO paper, and you should not cite them as such. Assume a simple enzyme with a single substrate, no cooperativity, and initial-rate measurements.
Condition A (no inhibitor): the curve is consistent with Vmax = 100 units/min and Km = 2 mM.
| [S] (mM) | 1 | 2 | 4 | 8 | 16 |
|---|---|---|---|---|---|
| v0 (units/min) | 33 | 50 | 67 | 80 | 89 |
Check: at [S] = 2 mM the rate is 50, exactly half of the 100 plateau, which is the definition of Km.
Condition B (inhibitor added at a fixed concentration): the new table looks like this.
| [S] (mM) | 1 | 2 | 4 | 8 | 16 |
|---|---|---|---|---|---|
| v0 (units/min) | 14 | 25 | 40 | 57 | 73 |
How would you read this quickly?
- Look at the plateau first. The uninhibited curve is close to 89 at [S] = 16 and still rising toward 100. The inhibited curve is at 73 and still rising. Extrapolate both: they are converging on the same asymptote near 100. That is the signature of unchanged Vmax.
- Now find half-maximal substrate. In Condition A, half of 100 is 50, happening at [S] = 2 mM. In Condition B, the plateau is still ~100, so half of that is ~50; the inhibited curve reaches 50 near [S] = 6 mM. Apparent Km has shifted from about 2 mM to about 6 mM.
- Match the signature. Vmax unchanged, apparent Km increased: competitive inhibition. The inhibitor is being outcompeted as [S] climbs, which is why the two curves converge at high substrate.
By contrast, if Condition B had plateaued near 33 units/min with half-max still at [S] = 2 mM, the pattern would be pure noncompetitive: Vmax cut to roughly one third, apparent Km unchanged. If instead the plateau had fallen and the half-max had shifted to a lower [S], the pattern would point to uncompetitive.
The four-second diagnostic for any inhibition item
When you meet an inhibition figure under time pressure, run this order of operations in your head.
- Identify axes. Is this v0 vs. [S], a Lineweaver-Burk plot, a progress curve, or a bar chart of rates at one [S]? The tool depends on this.
- Locate the plateau. On a Michaelis-Menten plot, the greatest [S] value tells you where the two curves are going, but never assume you have reached the plateau; extrapolate the trend. On a Lineweaver-Burk plot, the intercepts (1/Vmax on the y-axis, −1/Km on the x-axis) give the same information more cleanly.
- Compare parameter maps. Speak it softly to yourself: “Vmax up, down or the same? Km up, down or the same?” That two-by-two table collapses the search.
If the figure is a Lineweaver-Burk plot, the signatures are worth memorising as shapes: competitive lines intersect at the y-axis, noncompetitive lines intersect at the x-axis, uncompetitive lines run parallel.
Common trap: a lower rate is not a lower Vmax
The single most frequent error we see in mock work is reading a depressed rate at low [S] as evidence that Vmax has fallen. In competitive inhibition, at any pre-saturation [S] the inhibited rate is lower than the uninhibited rate, but the plateau is unchanged. Candidates who glance at one mid-range point and conclude “Vmax down, must be noncompetitive” are answering a question they were not asked. Beware the mirror error as well: in pure noncompetitive inhibition the plateau drops and Km does not change, so low-[S] rates are also lower than in the uninhibited curve. If low-[S] rates look similar while the plateau drops, consider uncompetitive inhibition, because Vmax and Km fall by the same factor.
Our earlier compilation of school-biology shortcuts that the USABO punishes, at Twelve School-Biology Simplifications the USABO Punishes — and What to Replace Them With, touches on a related pattern: the exam often rewards recognising when two quantities move independently, and enzyme kinetics is the cleanest case of that idea in the whole cell-biology section.
Practice routine: build your own curves
Fluency in this topic comes from drawing, not re-reading. Set aside one revision session to sketch Michaelis-Menten curves for the following four scenarios on the same axes, without notes:
- Baseline enzyme with Km = 1 (arbitrary units).
- Competitive inhibitor: same plateau, right-shifted curve.
- Noncompetitive inhibitor: same midpoint, lower plateau.
- Uncompetitive inhibitor: lower plateau and left-shifted midpoint.
Then redraw all four as Lineweaver-Burk plots and check whether the intercept-sharing relationships still look right to you. If you can do this twice from memory with the correct intercept positions, you will not lose inhibition-type marks from visual confusion. If you can also write the table version — one column per condition, half-max row and plateau row explicit — you will have covered the two most common figure formats the USABO uses.
Because a genuine USABO item will rarely tell you the model assumptions, a final habit is useful: before you compute, state to yourself what you are assuming (single substrate, no cooperativity, no product inhibition). If the item’s data violates any of those assumptions, the classical two-by-two table will not fit and you should consider that the exam is deliberately testing whether you notice.
Where this fits in USABO preparation
Quantitative enzyme kinetics is one of the clearest gaps between standard school biology and USABO-level cell biology. AP Biology, A-Level Biology and IB Biology HL each cover enzymes, but each leaves additional quantitative Km/Vmax work for the competition context. That is not a reason to start from a university biochemistry text; it is a reason to make sure the handful of skills above are automatic before the exam. Treat this as a small, well-bounded skill set: four parameters, two axes, three inhibition classes, one diagnostic order. When you can look at an unfamiliar curve and reach the plateau/midpoint comparison in under a minute, most inhibition questions become routine trades of observation for marks.
This topic sits within the broader Cell Biology section, which constitutes approximately 20% of the USABO syllabus. For a comprehensive breakdown of how to approach this section, refer to our guide on The Cell Biology 20%: Turning USABO’s Second-Biggest Section Into Reliable Marks.
If you find that you keep identifying the wrong inhibition type even though the definitions feel clear, the useful next step is not more reading but a topic-level diagnostic: somebody who can watch you read three figures and tell you exactly where the inference breaks. Bring two or three figures that cost you marks, plus the notes you made while reading them, and use whatever consultation channel your preparation provider offers. That is a far more efficient use of an hour than another broad review of enzyme vocabulary.
Frequently Asked Questions
Does competitive inhibition always increase apparent Km?
In the simple competitive model, yes. Because the inhibitor can be outcompeted by substrate, the plateau (Vmax) is preserved, but more substrate is needed to reach half of that plateau, so apparent Km increases. Real systems that deviate from the simple model can behave differently, and a USABO item that supplies a small table usually expects you to read the pattern before naming the class.
Can inhibition type be decided from a single rate measurement?
No. A single point on the curve cannot distinguish classes, because the diagnostic depends on how the curve behaves across a range of [S] — specifically on the plateau and the half-maximal substrate concentration. You need at least a few points spanning sub-saturating to near-saturating [S], or a Lineweaver-Burk plot with intercepts.
Is the Lineweaver-Burk plot required on the USABO?
Conceptual items are often answerable from Michaelis-Menten curves alone. However, Lineweaver-Burk plots do appear in data-interpretation questions because the intercepts (1/Vmax and −1/Km) make inhibition type transparent. Being able to read the intercept pattern — competitive lines meeting on the y-axis, noncompetitive on the x-axis, uncompetitive parallel — is a small amount of work for a large payoff.