Why Band Patterns Confuse Even Prepared Students
USABO Open Exam questions that show a gel electrophoresis image often test one specific skill: can you connect the visual band pattern to the biological question that the experiment was designed to answer? Many students recognize the technique—DNA fragments separated by size through an agarose matrix—but stop there. They describe the pattern without ever answering why the researcher ran the gel.
This article works through two hypothetical teaching examples that model the reasoning USABO expects. The first shows a straightforward case where band position maps directly to genotype. The second shows where the first assumption fails, forcing a reinterpretation. A diagnostic table at the end helps you check your own practice answers for the same error pattern.
Hypothetical Example 1: Mapping Bands to Genotype
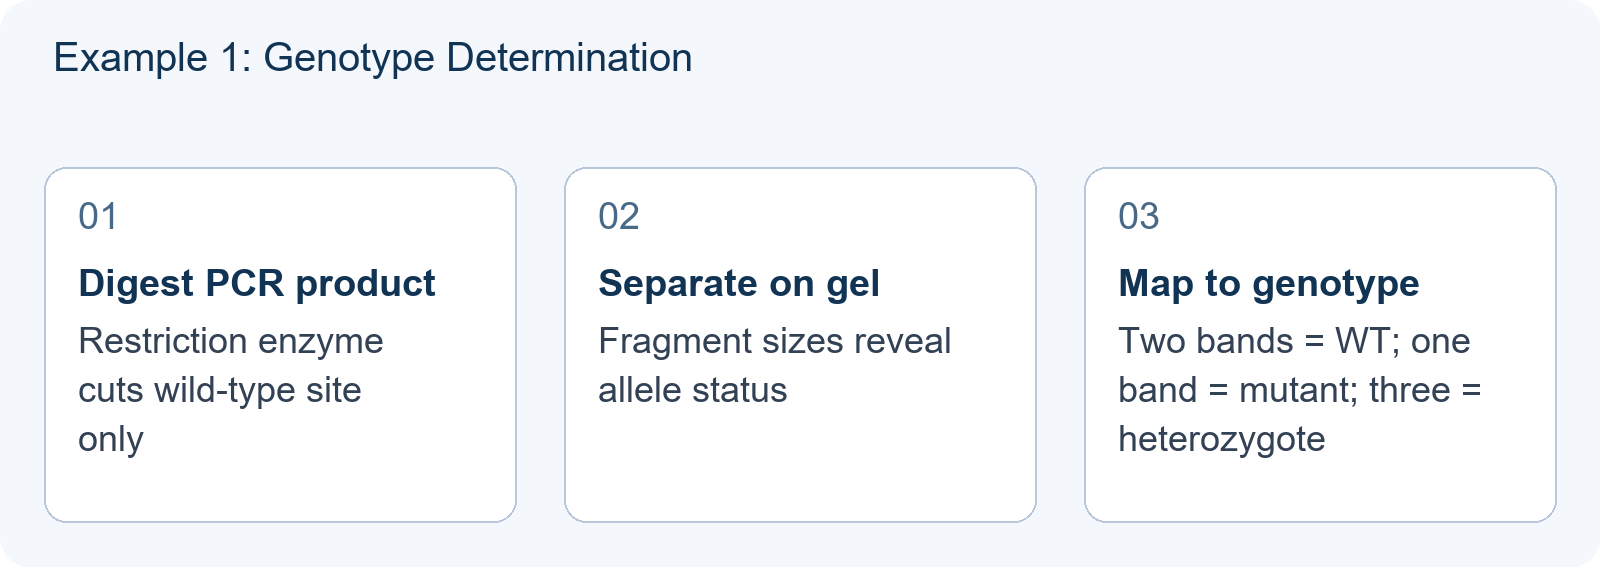
The setup (hypothetical teaching illustration): A researcher investigates a single-gene disease with a known restriction site polymorphism. The wild-type allele contains a restriction site; a point mutation destroys it. After PCR amplification and restriction enzyme digestion, products are run on an agarose gel.
The gel pattern:
- Lane 1: 100 bp ladder
- Lane 2: Two bands at 300 bp and 200 bp
- Lane 3: One band at 500 bp
- Lane 4: Three bands at 500 bp, 300 bp, and 200 bp
The reasoning chain:
- The 500 bp band represents the undigested fragment: the mutant allele lacks the restriction site.
- The 300 bp + 200 bp pair represents the digested wild-type allele.
- Lane 2 = homozygous wild-type; Lane 3 = homozygous mutant; Lane 4 = heterozygous.
The experimental question answered: What is the genotype of each subject with respect to this disease-associated polymorphism?
This case rewards direct translation: band count and position → fragment sizes → presence/absence of restriction site → genotype. No competing interpretation exists because the enzyme and amplicon size are specified.
Hypothetical Example 2: Where the First Assumption Fails
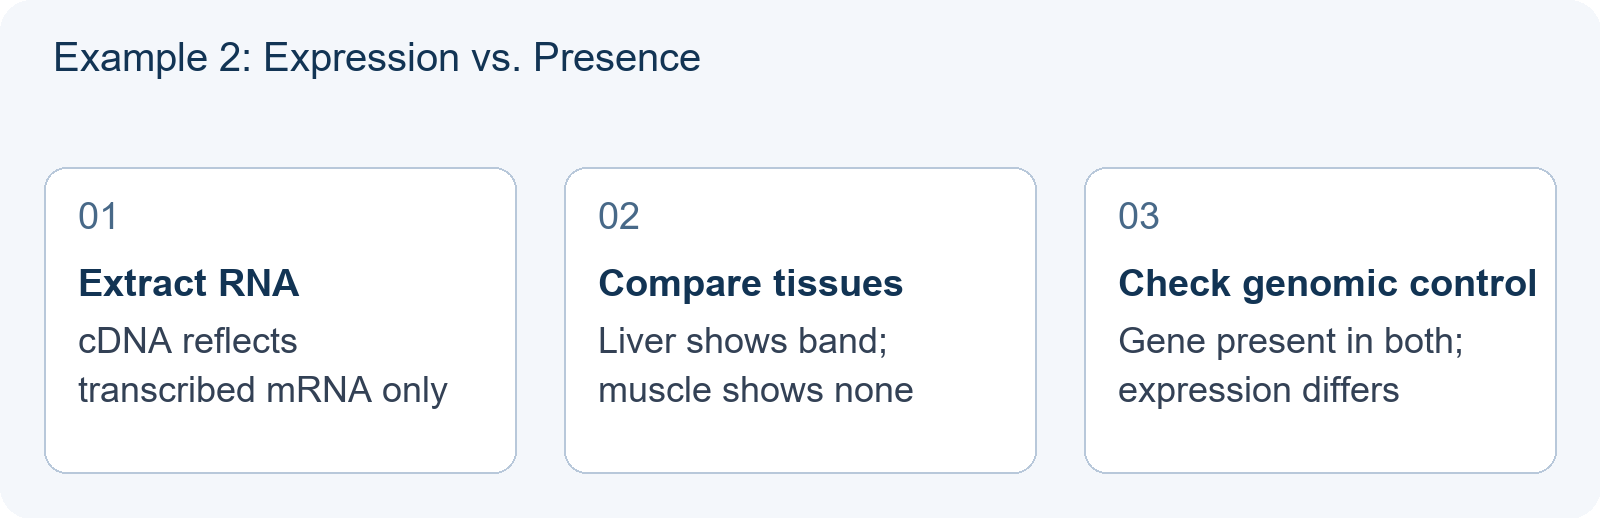
The setup (hypothetical teaching illustration): A researcher studies gene expression in two tissue types from the same organism: liver and muscle. Total RNA is extracted, reverse-transcribed to cDNA, and a specific target is amplified by PCR. The PCR products are run on a gel.
The gel pattern:
- Lane 1: 100 bp ladder
- Lane 2 (liver cDNA): Strong band at 450 bp
- Lane 3 (muscle cDNA): No visible band
- Lane 4 (liver genomic DNA): Band at 650 bp
- Lane 5 (muscle genomic DNA): Band at 650 bp
The tempting wrong answer: “The gene is absent in muscle tissue.”
Why this fails: The genomic DNA control in Lanes 4–5 shows the gene is present in both tissues. The 650 bp band represents the intact genomic sequence with introns. The 450 bp cDNA band in liver only indicates the mature transcript is present there. Muscle may transcribe the gene at undetectable levels, or the transcript may be unstable—but the gene itself is not absent.
The experimental question answered: Is this gene expressed (transcribed into mature mRNA) in liver versus muscle tissue?
The critical distinction: Example 1 asks about DNA sequence variation; Example 2 asks about RNA expression. The same gel technique serves both, but the biological question completely changes what the bands mean.
Diagnostic Table: Checking Your Own Reasoning
| If your first thought is… | Ask yourself… | Then check whether… |
|---|---|---|
| “More bands = more copies of the gene” | Is this DNA or RNA? Genomic or cDNA? | Genomic DNA controls show identical banding regardless of expression |
| “No band = gene deletion” | Did I check a genomic DNA control lane? | Expression level and detection sensitivity explain absence |
| “Band size difference = mutation” | Could this be alternative splicing or different transcript isoforms? | cDNA from the same gene can yield multiple sizes |
| “Faint band = heterozygous” | Is this semi-quantitative data, or just loading variation? | USABO rarely expects quantification without a loading control |
A Targeted Practice Sequence
To build reliable gel interpretation skills for USABO:
- Identify the molecule type first. Before analyzing any pattern, confirm whether the gel shows genomic DNA, cDNA, plasmid DNA, or RNA. This determines whether you should think about restriction sites, splicing, expression levels, or topological forms.
- Locate the control lanes explicitly. Every complete experiment includes controls. Ask what each control validates and what would invalidate the interpretation.
- State the experimental question in your own words. If you cannot phrase what the researcher wanted to know, you cannot evaluate whether the pattern answers it.
For guidance on evaluating whether a practice question is worth your time, see How to Judge a USABO Practice Question Before You Trust It. To strengthen your general approach to data and experiment items on the Open Exam, see The Figure Is the Question: How to Read Data and Experiment Items on the USABO Open Exam. When official practice material runs thin, our guide on USABO Practice Questions: Building Your Own When Official Sources Run Thin offers a structured method for creating valid additional problems.
What Skill to Demonstrate Next
After working through these examples, you should be able to: given an unlabeled gel image and a brief experimental description, correctly identify (a) what biological variable the band pattern reports, (b) what control lanes are necessary to validate that interpretation, and (c) the most common alternative interpretation that would make the conclusion premature.
This skill appears not only in direct gel questions but also in integrated experimental design problems where USABO asks you to select or critique an appropriate analytical method.
Frequently Asked Questions
Does USABO use real experimental data in gel electrophoresis questions, or simplified diagrams?
USABO typically presents simplified schematic gels with clearly resolved bands. The challenge is not measuring precise band positions but correctly interpreting what the pattern means in the stated experimental context. Practice with conceptual reasoning rather than precision measurement.
How can I tell if a gel shows genomic DNA or cDNA when the question does not explicitly state it?
Look for contextual clues: presence of intron-size fragments suggests genomic DNA; multiple bands from the same gene may indicate alternative splicing in cDNA; reference to tissue types or treatment conditions usually implies expression analysis using cDNA. Always check whether genomic DNA controls are included.
Should I memorize common restriction enzyme recognition sites for USABO?
USABO does not require memorization of specific recognition sequences. Focus instead on understanding how restriction site presence or absence creates interpretable band patterns, and how to deduce genotype or construct maps from given fragment sizes.