For students preparing for the USA Biology Olympiad (USABO), ecology questions often hinge on interpreting graphical data. A common stumbling block is confusing population size with growth rate. While related, these two metrics tell different stories about a species’ status. Misinterpreting them can lead to incorrect answers on multiple-choice questions regarding carrying capacity, exponential versus logistic growth, and environmental resistance.
The Core Distinction
Population Size (N) is the total number of individuals at a specific time. On a graph, this is typically the Y-axis value if plotting N against Time (t).
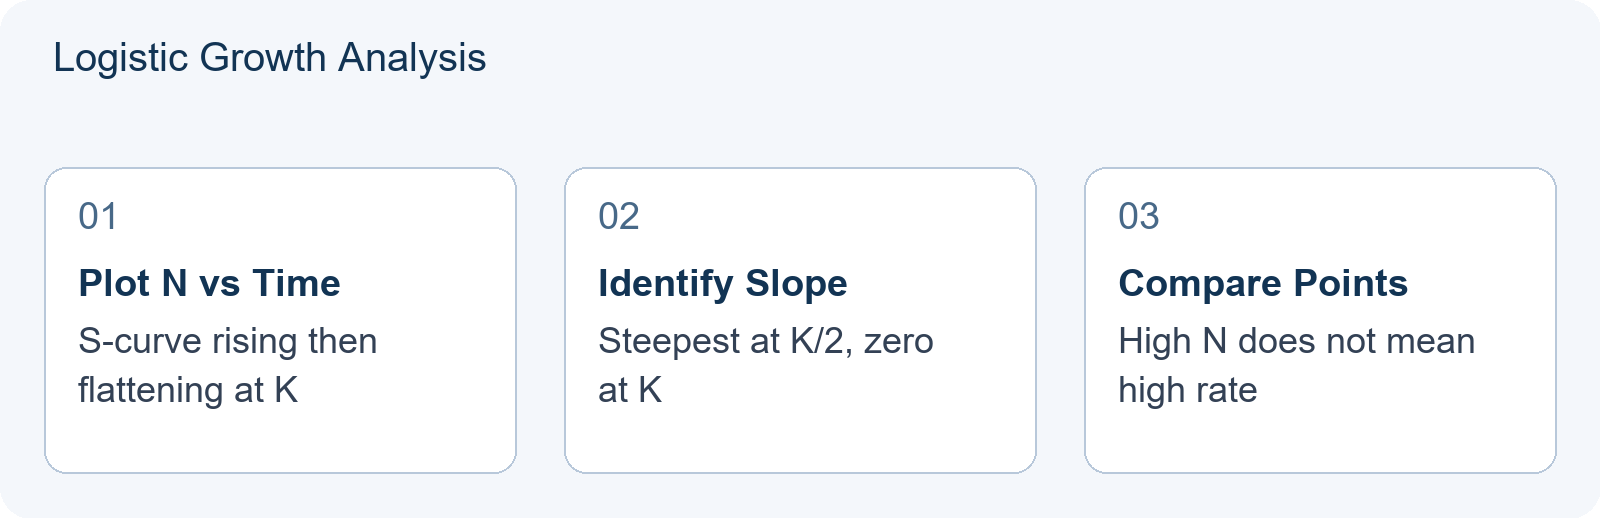
Growth Rate (dN/dt) is how fast the population is changing at that moment. It represents the slope of the population curve. In exponential growth models, the growth rate increases as the population gets larger. In logistic growth models, the growth rate peaks at half the carrying capacity () and drops to zero when the population reaches .
A frequent error occurs when students see a high population number and assume it means rapid growth, or vice versa. For instance, a population near its carrying capacity might be very large but have a growth rate close to zero because births equal deaths. The key skill is reading the slope of the curve, not just its height.
Teaching Illustration 1: The Logistic Curve Trap
The following is an original teaching illustration, not an official USABO past-paper question.
Imagine a graph showing a classic S-shaped logistic growth curve. The X-axis is Time, and the Y-axis is Population Size (). The carrying capacity () is marked at 1000 individuals.
- Point A: At , . The curve is steep here. The growth rate is high.
- Point B: At , . The curve is flattening out. The population size is much larger than at Point A, but the growth rate is significantly lower.
If a question asks, “At which point is the population growing fastest?”, the answer is Point A, not Point B. Students who focus only on the absolute height of the curve (size) will incorrectly choose Point B. This distinction is critical for understanding density-dependent factors.
Teaching Illustration 2: Exponential vs. Linear Confusion
The following is an original teaching illustration, not an official USABO past-paper question.
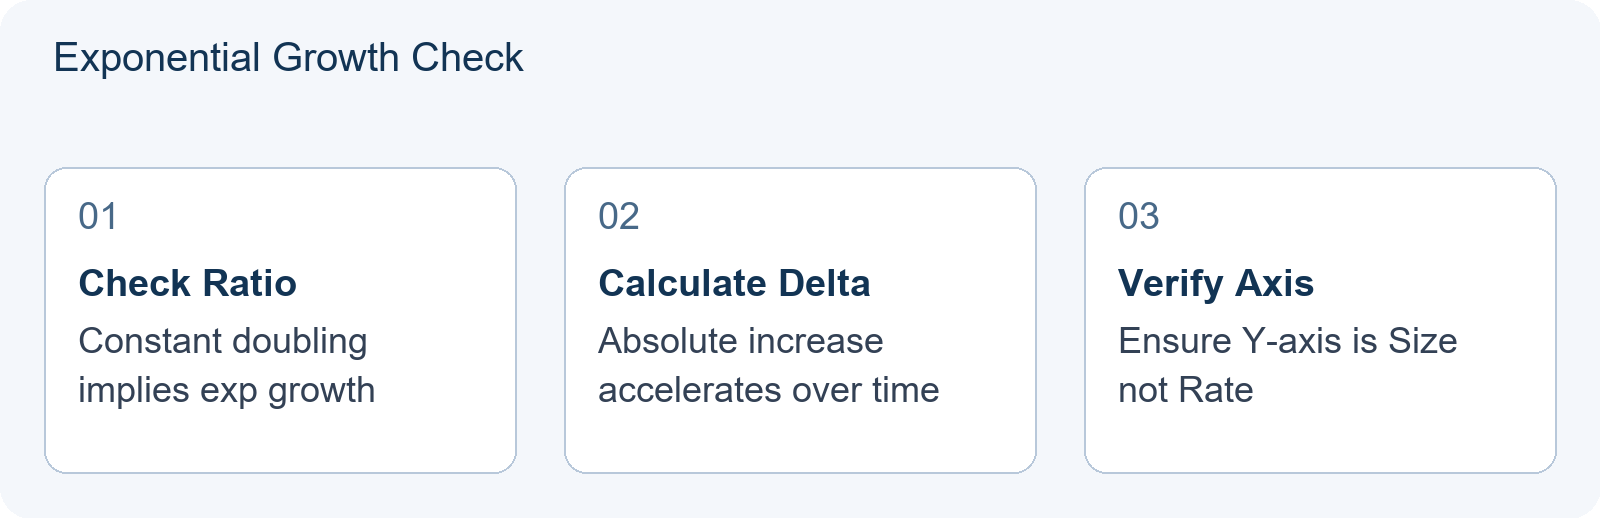
Consider a dataset where population size doubles every year. Year 1: 10 individuals. Year 2: 20. Year 3: 40. Year 4: 80.
Calculate the change in size per year:
Year 1-2: +10
Year 2-3: +20
Year 3-4: +40
The growth rate (change in N per unit time) is increasing. However, if you plot Growth Rate on the Y-axis instead of Population Size, the shape changes. A common exam trick involves presenting a graph of Growth Rate vs. Time. If the growth rate is constant, the population grows linearly. If the growth rate increases in proportion to population, the population grows exponentially. Recognizing which variable is plotted is the first step to avoiding calculation errors.
Translating Between Two Graph Types
USABO questions may show either vs. or vs. . You must translate mentally between them:
- On an vs. graph, the growth rate is the slope at any point.
- On a vs. graph, the value itself is the growth rate, and the area under the curve gives total population change.
- For logistic growth, the curve is a symmetric hump peaking at , while the curve is S-shaped.
Practice sketching both forms from the same scenario. If you can draw the hump from the S-curve, or vice versa, you have mastered the relationship.
Diagnostic Table: Common Misinterpretations
| Graph Feature | Correct Interpretation | Common Mistake | Check-Step |
|---|---|---|---|
| Steep upward slope | High positive growth rate | Assuming population size is maximum | Read the Y-axis label first |
| Flat horizontal line | Growth rate is zero; stable population | Assuming extinction or no individuals present | Check if Y is Size or Rate |
| Downward slope | Negative growth rate (decline) | Confusing decline with low initial size | Confirm direction of change |
| Peak of derivative curve | Maximum growth rate (often at ) | Confusing with peak population size () | Ask: is this rate or size? |
A Targeted Practice Sequence
To build reliable skill for USABO Population Graphs, follow this sequence:
- Sketch first: Draw logistic and exponential curves from memory. Label axes explicitly. Mark where growth rate is maximum, zero, and negative.
- Dual representation: For each curve, draw the corresponding vs. graph. Verify that the peak of the rate curve aligns with the inflection point of the size curve.
- Timed self-test: Give yourself 90 seconds per graph. State the axis labels, identify the maximum growth rate point, and predict one density-dependent factor that would shift .
- Error log: Record which graph types cause hesitation. Return to those after 48 hours.
For additional practice building your own questions when official sources run thin, see USABO Practice Questions: Building Your Own When Official Sources Run Thin. For guidance on selecting useful past papers and checking answer coverage, refer to USABO Past Papers: Choosing Useful Practice and Checking Answer Coverage. China-based families should also verify registration requirements in USABO Registration: What China-Based Families Must Verify Before the Deadline.
What You Should Be Able to Demonstrate Next
After working through these illustrations, you should be able to: (1) Given an vs. graph, sketch the corresponding vs. curve; (2) Identify by inspection whether a labeled point has higher size or higher growth rate; (3) Predict how a change in carrying capacity would alter both curves; and (4) Complete 50-question timed practice without confusing slope with height. This skill transfers directly to the USABO Open Exam format of 50 multiple-choice questions in 50 minutes, where rapid graph interpretation separates candidates who manage time from those who do not.
Remember, USABO questions test your ability to apply biological principles to data. Distinguishing between state variables (like size) and rate variables (like growth) is a fundamental skill in ecology and physiology alike.
Frequently Asked Questions
Does a higher population always mean faster growth?
No. In logistic growth, the population size is highest at carrying capacity, but the growth rate is zero there. The fastest growth usually occurs at half the carrying capacity.
How do I identify the growth rate on a graph?
If the graph plots Population Size vs. Time, the growth rate is the slope of the curve at any given point. If the graph plots Growth Rate vs. Time, the Y-value itself is the rate.
Is this concept tested in the USABO Open Exam?
Yes, ecology and population dynamics are key components of the USABO syllabus. The Open Exam consists of 50 multiple-choice questions in 50 minutes, and questions often require interpreting data trends rather than just recalling definitions.