For students preparing for the USABO Linkage Mapping section, a common pitfall is assuming that recombination frequency (RF) directly equals physical distance without accounting for multiple crossovers. The USABO syllabus allocates approximately 20% to Genetics and Evolution, where linkage analysis often appears in data interpretation questions. Understanding the difference between observed recombinants and actual map units is critical for accurate scoring.
The Core Concept: RF vs. Map Distance
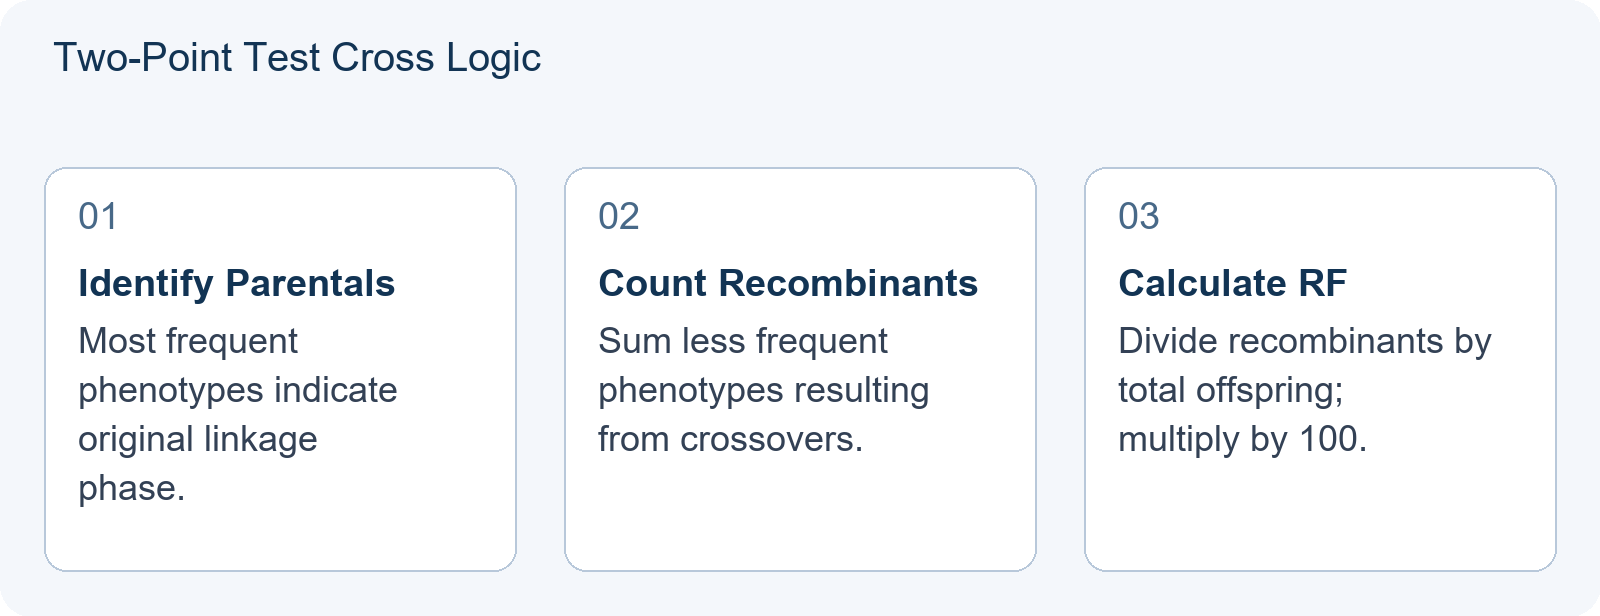
In a standard test cross involving two linked genes, offspring phenotypes reveal whether alleles have swapped chromosomes via crossing over. Parental types are non-recombinant; they retain the original linkage phase. Recombinant types result from crossover events between the loci. The recombination frequency is calculated as:
RF = (Number of Recombinants / Total Offspring) × 100%
However, this observed RF is an approximation. As the distance between genes increases, the probability of double crossovers (DCOs) rises. A DCO restores the parental configuration, making it undetectable in simple two-point crosses. Consequently, observed RF underestimates the true genetic distance for loci far apart. This limitation is why three-point mapping exists, but for USABO Open Exam purposes, recognizing when RF caps at 50% (indicating independent assortment or very distant linkage) is vital.
Hypothetical Teaching Illustrations
Note: The following datasets are hypothetical teaching illustrations, not actual USABO contest problems or official scoring guidance. They demonstrate calculation logic only.
Illustration 1: Linked Genes with Detectable Recombination
Consider a test cross for two genes, A and B. The offspring counts are:
| Phenotype | Count | Type |
|---|---|---|
| AB | 420 | Parental |
| ab | 380 | Parental |
| Ab | 110 | Recombinant |
| aB | 90 | Recombinant |
| Total | 1000 |
Calculation: Total Recombinants = 110 + 90 = 200. Total Offspring = 1000. RF = 200/1000 = 20%. Since 20% is well below 50%, these genes are linked. The map distance is approximately 20 centimorgans (cM), though slight underestimation may occur if DCOs exist within this interval.
Illustration 2: Independent Assortment or Distant Linkage
Now consider a different dataset:
| Phenotype | Count | Type |
|---|---|---|
| AB | 250 | Parental-like |
| ab | 250 | Parental-like |
| Ab | 250 | Recombinant-like |
| aB | 250 | Recombinant-like |
| Total | 1000 |
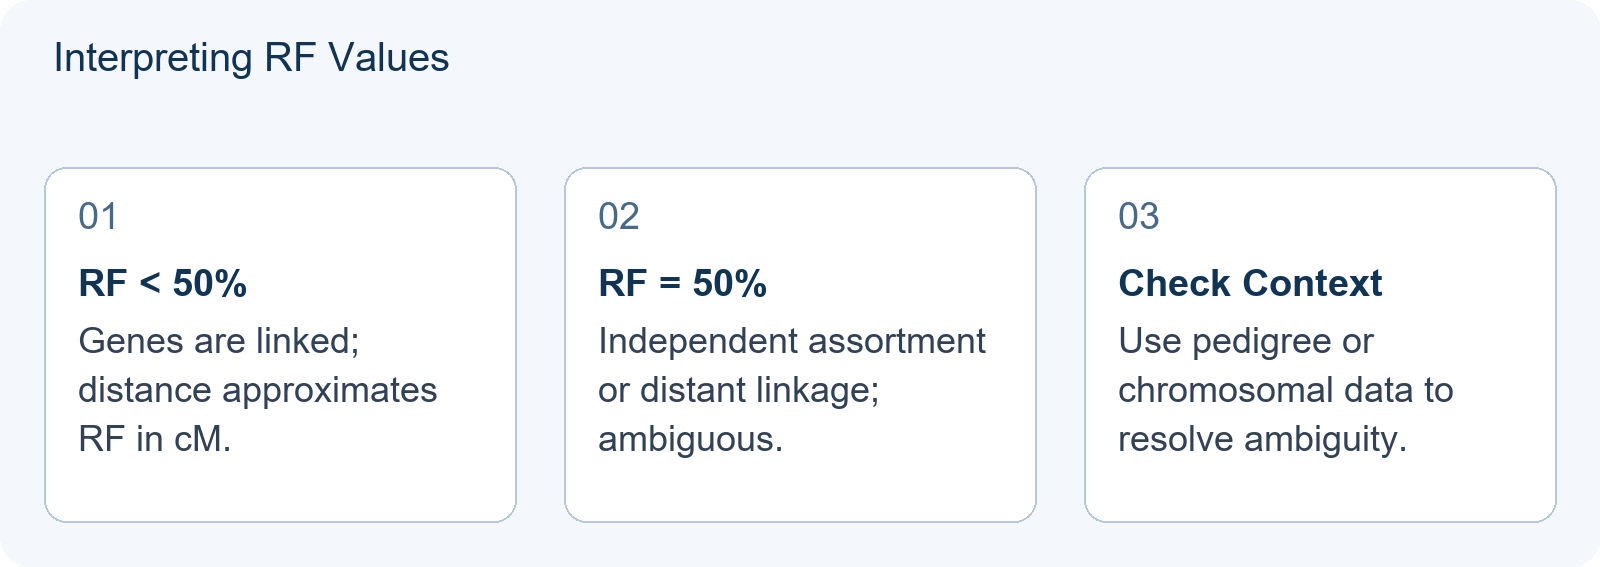
Calculation: Total Recombinants = 500. RF = 500/1000 = 50%. An RF of 50% indicates either genes on different chromosomes (independent assortment) or genes so far apart on the same chromosome that multiple crossovers randomize their association. In USABO questions, you cannot distinguish these scenarios by RF alone; additional pedigree or chromosomal context is required.
Common Logical Errors in Preparation
Students often mistakenly add single-crossover frequencies from adjacent intervals to calculate outer-marker distance without considering that map distance is defined by the sum of interval distances (including DCOs twice). Observed recombination between outer markers underestimates this sum because DCOs appear parental. For two-point mapping, simply calculating RF is sufficient, but interpreting its biological meaning requires caution. Do not assume linearity beyond ~20-30 cM without correction functions like Haldane’s or Kosambi’s, which are rarely required for basic USABO Open Exam calculations but conceptually important.
To strengthen your grasp of these concepts, review resources on The Genetics & Evolution 20%: A Problem-Solving Playbook for USABO Calculation Questions. Additionally, practice interpreting experimental data through The Figure Is the Question: How to Read Data and Experiment Items on the USABO Open Exam. For broader preparation strategies, see USABO Practice Questions: Building Your Own When Official Sources Run Thin.
Interpreting Recombination Data in Small Samples
The previous sections established the theoretical relationship between recombination frequency (RF) and map distance. However, a critical practical gap for USABO candidates is understanding how sample size affects RF reliability. In real experimental genetics, offspring counts are finite. A small dataset can produce an RF that deviates significantly from the true genetic distance due to random sampling error, even if the genes are linked.
Hypothetical Teaching Illustration: Sampling Variance
Note: The following data is a hypothetical teaching illustration, not actual contest data. It demonstrates statistical noise in small samples.
Assume two genes are truly 10 cM apart (expected RF = 10%). Consider two different test crosses with varying total offspring:
| Scenario | Total Offspring | Recombinants | Observed RF | Deviation from True RF |
|---|---|---|---|---|
| A (Large Sample) | 1000 | 95 | 9.5% | -0.5% |
| B (Small Sample) | 50 | 8 | 16.0% | +6.0% |
In Scenario B, the observed RF of 16% suggests a much larger distance than the true 10%. If a student blindly converts this RF to map units without considering confidence intervals or chi-square tests, they will overestimate the distance. Conversely, a small sample might yield only 4 recombinants out of 50 (RF = 8%), underestimating the distance. This variance is inversely proportional to the square root of the sample size.
Practical Application for USABO Questions
When interpreting linkage data on the exam, check the total number of offspring provided. If the count is low (e.g., <100), be cautious about precise map distance calculations. Look for clues indicating whether the question expects you to account for statistical uncertainty or simply apply the formula . Often, USABO questions provide large datasets to minimize this error, but conceptual questions may ask why observed RF differs from expected values in small families.
Furthermore, remember that RF cannot exceed 50%. If a calculation yields an RF > 50%, it indicates either independent assortment or a fundamental error in identifying parental vs. recombinant phenotypes. Always verify which phenotypes are most frequent to correctly assign parental types before calculating RF.
To practice distinguishing signal from noise in biological data, review The Figure Is the Question: How to Read Data and Experiment Items on the USABO Open Exam. For broader problem-solving strategies involving calculations, see The Genetics & Evolution 20%: A Problem-Solving Playbook for USABO Calculation Questions.
Frequently Asked Questions
Does a 50% recombination frequency always mean genes are on different chromosomes?
No. It can also mean genes are very far apart on the same chromosome, where multiple crossovers make them appear unlinked. Additional evidence is needed to distinguish these cases.
Why is observed recombination frequency lower than actual map distance?
Double crossovers restore the parental genotype, making them invisible in two-point crosses. Thus, observed RF underestimates the true number of crossover events.
Are the examples in this article real USABO questions?
No. The numerical examples are hypothetical teaching illustrations designed to demonstrate calculation methods. They are not sourced from official past papers.